The Six Degrees of Separation theory: what it means for hiring, networks, and how talent actually moves
The Six Degrees of Separation theory says any two people on Earth are connected through a chain of no more than six acquaintances. Frigyes Karinthy proposed it in 1929. Stanley Milgram tested it in the 1960s. Facebook's data team measured it at 3.57 degrees in 2016. In 2026, with LinkedIn crossing one billion members and most professional networks stitched together by platform graphs, the working number for professionals is likely closer to three.
That number matters if you hire, source, or build talent programs. The world your candidates move through is much smaller than the résumé stack on your desk suggests. This article revisits the theory, the math behind it, what the latest data shows, and — because we run assessments and interviews for a living — what it changes about how you find and evaluate people.
What the Six Degrees of Separation theory actually says
In 1929, Hungarian author Frigyes Karinthy published a volume of short stories called Everything is Different. In one story, Chains, a character bets that he can reach any person on Earth through a chain of no more than five intermediaries. Karinthy's premise was simple: as communication and travel grow, the social distance between any two people shrinks.
The math is easier than it looks. Assume you know 50 people. Each of them knows 50 others you don't. Extend that six times and you reach 50^6 — roughly 15.6 billion contacts. The real graph is messier because friend circles overlap, but even with heavy overlap, the reachable population balloons fast.
The theory captured mathematicians, sociologists, and physicists. It also seeded the first recognizable social network — SixDegrees.com, launched in 1997 — which let users build a profile and map their connections a full six years before LinkedIn.
The experiments that tested it
Milgram's small-world experiment (1967)
Stanley Milgram asked residents of Omaha, Nebraska and Wichita, Kansas to get a letter to a target person in Boston by forwarding it only to someone they knew on a first-name basis. Of the chains that completed, the median length was between five and six intermediaries. That's where the "six degrees" number comes from.
The experiment has real limitations. Most chains never completed. Later researchers, including Judith Kleinfeld at the University of Alaska Fairbanks, argued Milgram's data was thin and geographically narrow. But the finding held up in later studies: real social graphs are "small worlds" — locally clustered, globally short.
The Kevin Bacon game
In the 1990s, college students turned the theory into a party game. Link any Hollywood actor to Kevin Bacon through shared film credits. The average Bacon number, calculated across the full IMDB graph, sits at roughly 3.1. The Oracle of Bacon still runs the calculation live.
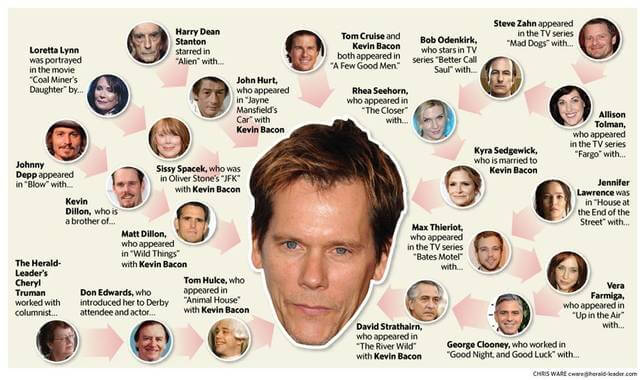
The Bacon game produced something Milgram's letters couldn't: a fully mapped graph. Researchers could finally test the theory against a complete dataset.
Facebook's measurement (2011, 2016)
In 2011, Facebook, researchers at Cornell, and the Università degli Studi di Milano computed the average separation across 721 million users at 3.74. By February 2016, with 1.59 billion active users, Facebook's research team reported the average had dropped to 3.57. The measurement used probabilistic graph algorithms including the Flajolet–Martin approach — a way to estimate distinct elements in a data stream without loading the whole graph into memory.
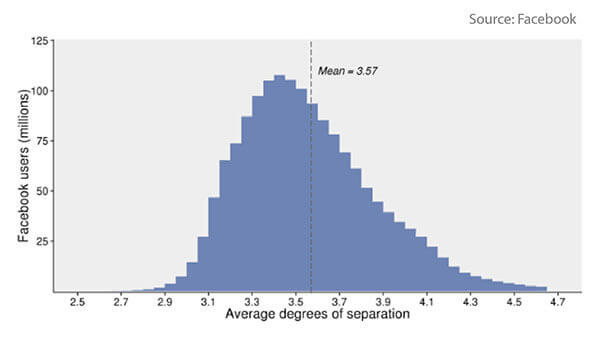
Six degrees was a 1929 thought experiment. Three-and-a-half degrees is a measured fact of the modern social graph.
Where the number stands in 2026
Facebook's 2016 study is still the most-cited measurement, and no comparable study has been published across LinkedIn's professional graph. But three shifts since then push the number down further:
- LinkedIn crossed one billion members in late 2023. Professional graphs are denser than general social graphs — colleagues connect to colleagues, alumni to alumni, ex-teammates to ex-teammates.
- Messaging platforms merged personal and professional graphs. WhatsApp, Slack, and Discord communities create weak ties that used to require an introduction.
- Developer communities are unusually dense. GitHub contribution graphs, open-source communities, and developer platforms create high-clustering pockets where separation numbers are often two, not three.
Follow-up analyses of large social graphs suggest the number keeps drifting downward as platforms consolidate. Nothing in the current literature contradicts that trajectory.
How the measurement works
Facebook explained their approach in a 2016 research post. The gist:
Assign each person in the graph a random hash. About half the hashes end in a 0 in binary form. A quarter end in 00. An eighth end in 000. So the pattern of trailing zeros in your friend group tells you roughly how many distinct people you can reach.
To compute the graph-wide average, you take the bitwise OR of the hashes across one hop, then two hops, then three, and count the trailing zeros. These probabilistic algorithms let you do this without keeping the full adjacency list in memory — critical when the graph has billions of edges.
You don't need to run this yourself. But it's worth knowing the number isn't a survey — it's a measurement across the full population of a billion-plus users.
Why this matters for hiring
Here's the operational point. If your candidates are separated from your existing team by three connections on average, several things follow.
Referrals should be your first-line source, not a bonus channel. Most hiring teams treat referrals as a nice-to-have. In a graph where every plausible candidate is three hops from your team, referrals aren't a supplement — they're the shortest path. Companies that structure referral programs around "who does your team know who has shipped X" outperform companies that source cold.
Cold sourcing is expensive because it ignores the graph. LinkedIn Recruiter searches, Boolean strings against Naukri, sequences to strangers — these work, but they're the long path. The candidate you're paying an agency $30,000 to find is almost certainly a warm intro away from someone on your team. Most recruiters don't run that check.
Community-driven sourcing has structural advantages. Hackathons, technical challenges, and developer communities cluster people by skill and interest. A challenge run against a technical community produces candidates who already share weak ties with each other and often with your existing engineers. This is why community-driven Hiring Challenges tend to produce candidates with denser overlap to your existing team than a generic job-board post — the graph is doing the sorting for you.
The proxy-candidate problem gets worse, not better. A small world cuts both ways. If a candidate can reach your interview panel in three hops, they can also reach someone willing to take the assessment for them. AI-generated résumés, ghostwritten take-homes, and proxy interviews are structural problems in a small graph — not one-off frauds. Identity verification and rubric-based evaluation stop being nice-to-haves.
What breaks the "six degrees" intuition
The theory has real limitations, and vendors who wave it around as a sourcing miracle usually skip them.
- Weak ties aren't warm ties. Being three hops from a candidate doesn't mean the candidate will respond to you. Mark Granovetter's 1973 paper The Strength of Weak Ties is the reference here — weak ties carry information, but not necessarily action.
- Graph density varies by industry and geography. Software engineering in Bangalore is a small world. Field-service technicians in a mid-size US city are not. Advice that works for tech hiring often fails for high-volume operational hiring.
- Homophily inflates apparent smallness. Your graph is short partly because you cluster with people like you. This is the same mechanism that creates hiring bias. A referral-heavy strategy without a structured rubric compounds representation problems.
- Small worlds don't mean easy discovery. Kevin Bacon is 2.9 degrees from every actor, but he's still hard to reach without an agent. Distance in the graph and access in the graph are different problems.
What this changes about assessment design
If the world is small, the signal you get on any single candidate matters more, not less. Three specifics.
Structured rubrics beat vibes. In a small graph, referrals bring in candidates who are already partially calibrated by your team's preferences. That's efficient, but it accelerates rubric drift — everyone starts saying yes to people like themselves. Rubric-based evaluation, applied consistently, is the correction. Structured, skills-based assessment platforms — including HackerEarth Assessments — exist to enforce that consistency across reviewers.
Identity verification is now infrastructure. In 2016, "is this the same person who took the assessment?" was a small-scale worry. In 2026, with AI-generated CVs and remote-proxy services advertising openly, it's a baseline requirement. Modern interview tools increasingly pair structured evaluation with identity verification, because the shortest path between a serious candidate and a proxy is now very short.
Community signal is undervalued. GitHub contributions, hackathon participation, open-source PRs — these are all measurable proof of work that sits inside the small-world graph. Most ATS workflows don't ingest them. That's a gap worth closing, especially for senior engineering hires where the graph signal is strongest.
The takeaway for talent leaders
The Six Degrees of Separation theory started as a 1929 short story and became a measurable property of the modern social graph. In 2026, the number is closer to three than six, and for most technical talent pools it's closer to two.
For CHROs: workforce strategy that treats external talent as a distant unknown is out of date. Your future hires are, on average, three connections from someone already on your payroll. Build the referral, community, and internal-mobility infrastructure that lets you see them.
For heads of TA: your sourcing mix is probably too weighted toward cold channels. Rebalance toward referrals, alumni, and community-driven challenges — the graph is short, but only if you use it.
For engineering managers: the small graph is the reason your hiring pool feels repetitive. Structured rubrics and skill-based evaluation are how you find the strong candidates the graph is hiding from your defaults.
FAQ
Is the Six Degrees of Separation theory scientifically proven?
It's measured, not proven. Facebook's 2016 study across 1.59 billion users measured average separation at 3.57 degrees using the Flajolet–Martin algorithm. Milgram's 1967 experiment produced the original six-degree number but had incomplete chains and a narrow sample. The theory holds up as a description of large social graphs. It does not hold up as a promise that any specific two people are easily reachable.
Does the theory apply to LinkedIn or professional networks specifically?
LinkedIn hasn't published a comparable graph-wide study. But professional graphs are typically denser than general social graphs — colleagues connect to colleagues, alumni to alumni — so the average is likely lower, not higher, than Facebook's 3.57. For technical talent pools with active community participation (GitHub, hackathons, developer platforms), the effective distance is often two hops.
Can I actually use this to hire faster?
Yes, but not by running graph queries. The operational move is to weight referrals, alumni networks, and community challenges more heavily in your sourcing mix, and to build the internal infrastructure — referral programs, community engagement, structured challenges — that surfaces the short paths. The math predicts the paths exist. The work is making them visible.
What's the downside of a small-world hiring graph?
Homophily. If your team is three hops from every candidate, it's also three hops from every candidate who looks, sounds, and thinks like your team. Referral-heavy hiring without rubric discipline compounds representation problems. The correction is structured skills-based evaluation applied consistently, not fewer referrals.
Next steps
If the small-world graph means anything for your hiring, it means the quality of your evaluation on each candidate matters more than the width of your funnel. Structured assessments, identity-verified interviews, and rubric-based scoring are the operational answer.
See how HackerEarth Assessments works — evaluate candidates against 1,000+ skills with a consistent rubric, whether they come from a referral, a challenge, or a cold source.